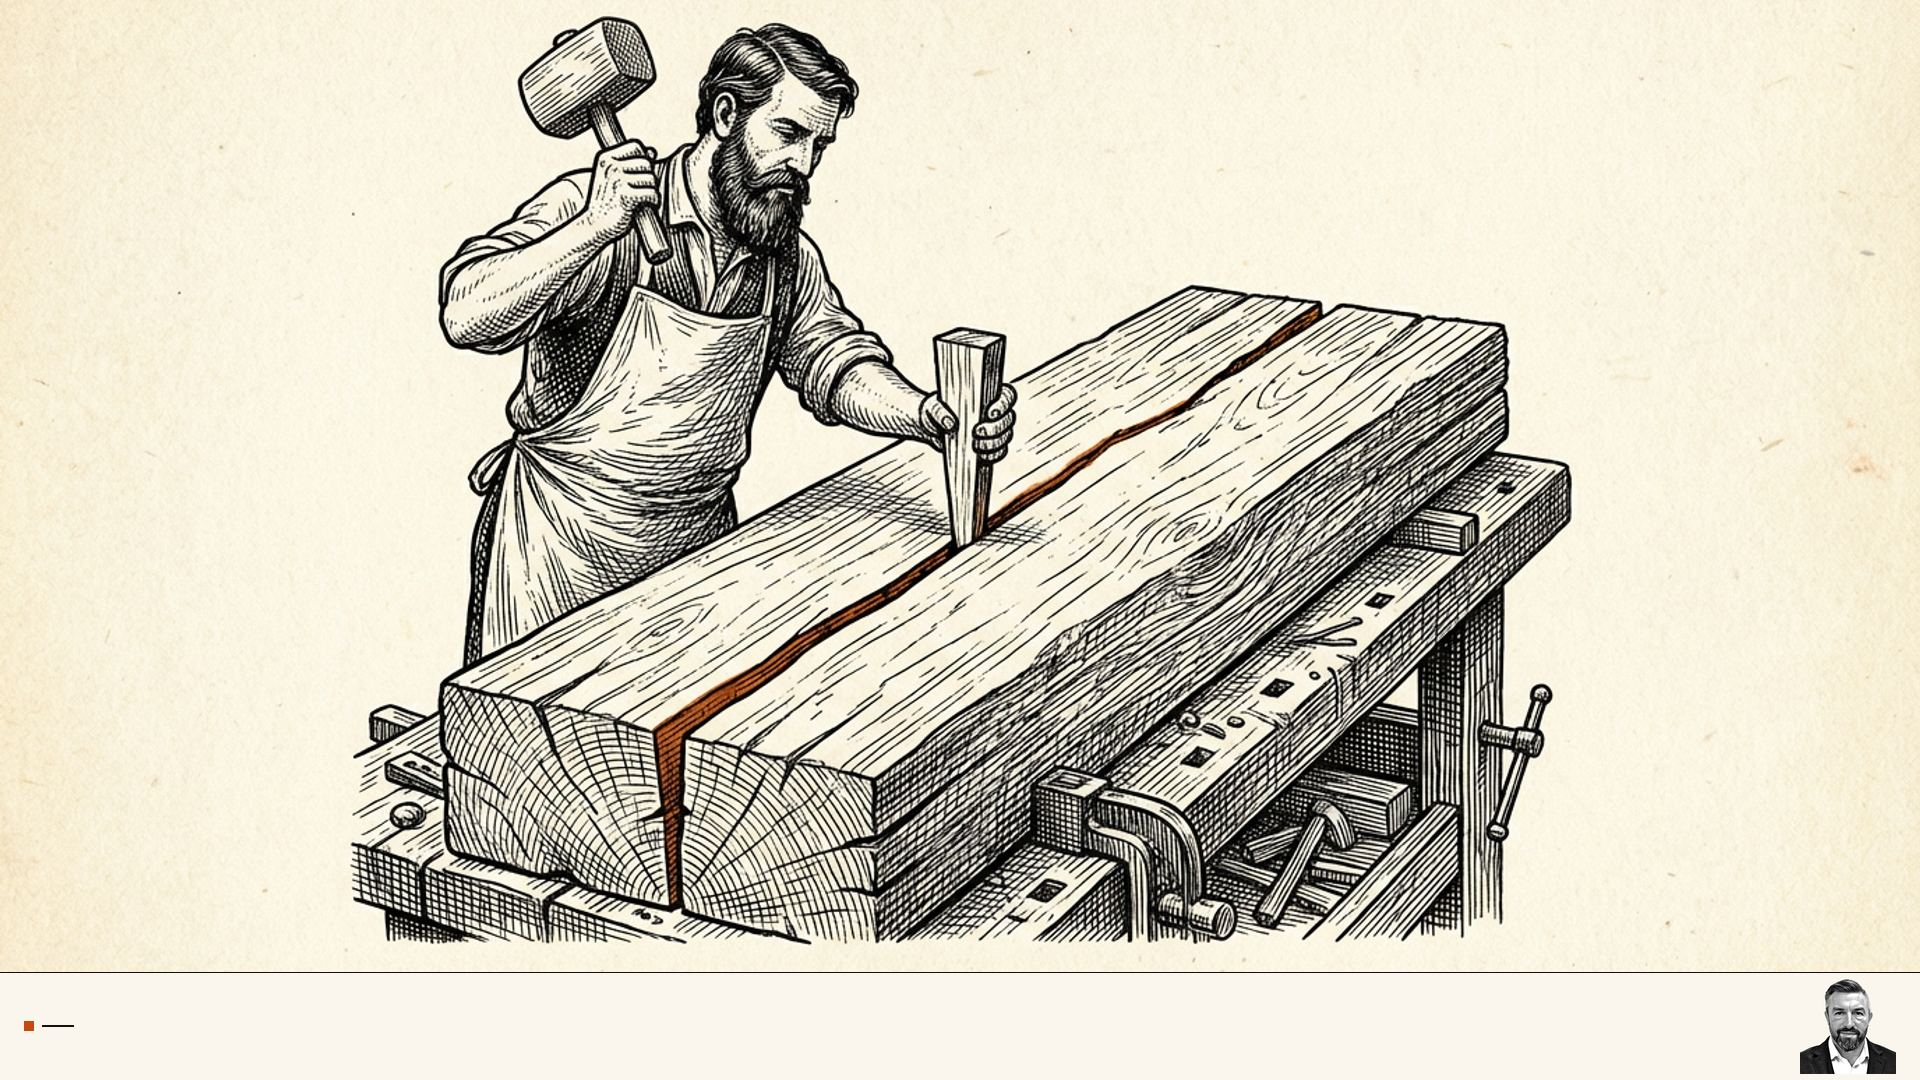
One of the surest ways to kill a team’s productivity is to saddle it with large stories.
What makes this tricky is that large stories often don’t look large on the surface. A story titled “Add user profile editing” sounds simple. It sounds like a few fields, a save button, maybe an hour or two. In reality it might involve validation logic, permission checks, audit logging, API changes, UI state management, and three edge cases that only surface during implementation. By the time the team figures that out, the sprint is half over.
Being able to identify when and how to break a story into smaller pieces is one of the most underrated skills in software development. And it’s a skill that should exist at every level: developer, dev manager, and product owner.
Why Story Size Matters More Than You Think
What Large Stories Do
-
Velocity becomes unpredictable. A team that’s carrying one 13-point story into the final days of a sprint is going to miss its commitment. Large stories are the primary driver of that late-sprint scramble where everything is “almost done” and nothing is shipped.
-
Feedback loops get long. Agile’s core value is shortening the distance between learning and action. A story that takes two weeks to complete generates no feedback for two weeks. Smaller stories that ship incrementally create opportunities to course-correct before you’ve built a week’s worth of the wrong thing.
-
Context switching costs multiply. When a developer carries a large, complex story across multiple days, each return to the work requires re-loading a lot of mental context. Smaller, well-scoped stories have tighter focus and tend to stay fresh.
-
The sprint becomes a waterfall. Teams with consistently large stories tend to de-facto serialize their work. Everyone waits for the big story to complete before the sprint “feels done.” Smaller stories allow true parallel progress.
What Good Story Splitting Looks Like
The goal of splitting is not to make stories artificially small. It is to find the natural seams in the work, places where you can ship something independently, verify it, and get real value delivered. The best seams usually follow a workflow or a user journey, not a technical layer.
Start with the workflow step or CRUD verb. Instead of “User can manage their profile,” look at the actual journey: view the profile, start an edit, change a field, save the change, and see the updated state. “Admin can manage users” may contain separate stories for creating a user, deactivating a user, and changing a user’s role. Each action has a distinct outcome, a clear definition of done, and a way to demonstrate value.
Use vertical slices. A vertical story includes the interface, API, data access, validation, tests, and any other work needed to make one user-facing outcome real. I do not recommend splitting the UI from the API as separate stories just because they are separate layers. In practice, implementing either side almost always requires touching the other, and the team ends up carrying two half-finished stories instead of one complete result. A vertical slice leaves you with working behavior and an honest demonstration.
Edge cases are often their own stories. The happy path can ship first when it is safe and useful on its own, while empty states, advanced validation, unusual error handling, imports, exports, and uncommon failure modes follow as explicitly planned work. That does not mean ignoring risks that make the first slice unsafe. It means distinguishing essential correctness from work that can be delivered and learned from independently.
Configuration and permissions frequently split along the same workflow lines. A different role or configuration is usually a different user, a different journey, or a different outcome. Treating it as a distinct story makes the behavior, authorization, acceptance criteria, and release decision visible instead of burying it inside a generic feature.
CRUD Is a Risk Signal
Every distinct function in a feature usually contains at least one CRUD operation. A simple dashboard preference may update a saved setting. Login redirection reads that setting and changes the next action. A report reads and transforms data. Layout editing reads a saved layout, updates it, and persists the result. Each operation has its own failure modes, tests, state transitions, and acceptance criteria.
This is why CRUD alignment is a primary test in my story-prefinement process. Each story should center on one primary CRUD verb: Create, Read or Display, Update or Edit, or Delete. Mixed verbs are a story-splitting flag, especially when the acceptance criteria hide extra scope behind phrases such as “and also.”
A story that creates, reads, updates, and transforms across several workflows is almost always hiding more work than its title suggests. Split those operations into small, vertically complete stories before the team commits to them. The individual story can still include every interface, API, data, validation, and test change required to deliver its one user outcome.
A Worked Example: The Big Bad Dashboard Story
Here is an actual story that was presented as a single item:
Description: As an admin user, I want to see key metrics on a dashboard as soon as I log in, instead of being routed to My Tasks, so I can make informed decisions about the direction of my department. I should also be able to choose whether the Dashboard or My Tasks is my landing page.
Acceptance criteria:
- An admin can choose Dashboard or My Tasks as the landing page, and that setting persists for the user.
- The selected landing page opens at login.
- The Dashboard contains a pie chart showing the percentage breakdown of open support-issue types.
- The Dashboard contains a configurable bar chart showing support tickets created during the last X weeks, months, quarters, or years.
- The timeframe controls have different numeric limits by unit and reset an invalid value when the unit changes.
- The Dashboard contains a scatter plot with error bars showing average support tickets by day of week, using the same configurable timeframe.
- The Dashboard has an edit mode that lets a user reorganize charts, and the layout persists for that user.
This reads like one dashboard request. It is a collection of landing-page preferences, persistent user settings, three reporting workflows, shared configuration rules, chart-specific behavior, authorization, layout editing, and personalization. That is a project. It will behave like one: incomplete at the end of the sprint, half-built functionality that cannot be demonstrated, and a “mostly done” status hiding a week of remaining work.
When we decomposed it properly, the work broke into 13 separate stories grouped into three logical features.
Feature 1: Initial Dashboard Launch
- Dashboard versus My Tasks setting.
- Dashboard versus My Tasks redirection.
- Pie graph for open support issues.
- Bar graph showing created support tickets in the last week.
- Scatter plot with error bars showing average support tickets by day of week for the last month.
Feature 2: Adding Timeframes to the Dashboard
- Allow a user to select a timeframe for the bar graph.
- Allow a user to select a timeframe for the scatter plot.
- Allow a user to select the number of periods for the bar graph.
- Allow a user to select the number of periods for the scatter plot.
Feature 3: Configuring the Dashboard
- Retrieve the saved dashboard layout for a user.
- Render a user’s dashboard from the saved layout.
- Save the dashboard layout for a user.
- Allow users to edit the dashboard layout.
The scope did not increase. We simply called out each distinct piece of work. In many cases, the individual story is small. That visibility reduces story-level risk and, ultimately, project risk because the team can estimate, test, demonstrate, and adjust one user outcome at a time.
The feature grouping also creates product options. Initial Dashboard Launch can ship first. Adding Timeframes follows when the basic reports prove useful. Configuring the Dashboard is a power-user enhancement that can be prioritized, deferred, or shelved without withholding the whole dashboard from users. In the original story, the configurable-dashboard requirement could have held up everything else.
This is the pattern. A story that feels like one thing often contains three or four independent workflows, each of which can be built, demonstrated, and released on its own timeline.
A useful rule of thumb: if a story estimates at 8 points or higher, treat that as a signal to examine it before it enters the sprint. Not every high-estimate story is splittable, but most of them are, and the team is usually better off finding the seams before the sprint starts rather than during it.
The Acceptance Criteria Test
A well-split story should have acceptance criteria that can be fully verified within the sprint without external dependencies. If you look at a story’s acceptance criteria and the team couldn’t realistically prove every condition is met before the sprint ends, it’s probably too large.
This is the fastest heuristic I use when reviewing stories before sprint planning. Read through the acceptance criteria. Ask: “Could we demonstrate every one of these conditions passing in a sprint review?” If the honest answer is no, the story needs work before it enters the sprint.
Who Owns This Skill?
Story splitting tends to get treated as a product owner responsibility, and it is, in part. But limiting it to product owners creates a bottleneck and produces worse stories.
Developers often know best where the complexity hides. They can see that “Add profile editing” is actually five separate problems. A product owner working in isolation might not know to split at those seams.
Dev managers and engineering leads can see the capacity math clearly. They know that a 13-point story in a 40-point sprint is a commitment risk, regardless of how the team feels about it.
When all three roles are contributing to story quality (product owners writing clear intent, developers identifying complexity and suggesting splits, and engineering leads ensuring the sprint commitment is realistic), the team’s throughput increases. Not because they’re working harder, but because the work is better organized.
The Resistance You’ll Encounter
Teams sometimes push back on story splitting because writing more stories feels like overhead. “We know what we’re building, so why do we need six stories instead of one?”
The answer is that six well-scoped stories generate six deployable increments, six opportunities for review and feedback, and six data points in your velocity tracking. One large story generates one opportunity (at the very end), and until then, progress is invisible.
Overhead is real. But the cost of imprecise planning shows up in missed commitments, late-sprint heroics, and stakeholders who’ve stopped trusting the team’s estimates. That cost is much higher than the fifteen minutes it takes to split a story properly.
Get good at splitting. It’s one of the highest-leverage improvements any team can make.
Receipts
- Dashboard decomposition: A dashboard request that initially read like one story was broken into thirteen stories across three features: initial launch, timeframes, and configuration. That gave the product owner release decisions instead of one all-or-nothing delivery date.
- Healthcare SaaS provider: Incremental delivery practices helped the team complete 63 releases in 52 weeks while moving a major reporting dashboard into customers’ hands in usable slices.
- Planning heuristic: An estimate of eight points or more is not automatic proof that a story is too large. It is a useful signal to inspect the acceptance criteria and look for independently shippable workflows before the sprint begins.